Research Study: Total Operating Expense Benchmarks for the RHCP-B and FHDP Programs
Overview
Project: Analysis of the Total Operating Expenses Benchmark Ranges
Programs: RHCP-B and FHDP
Brief
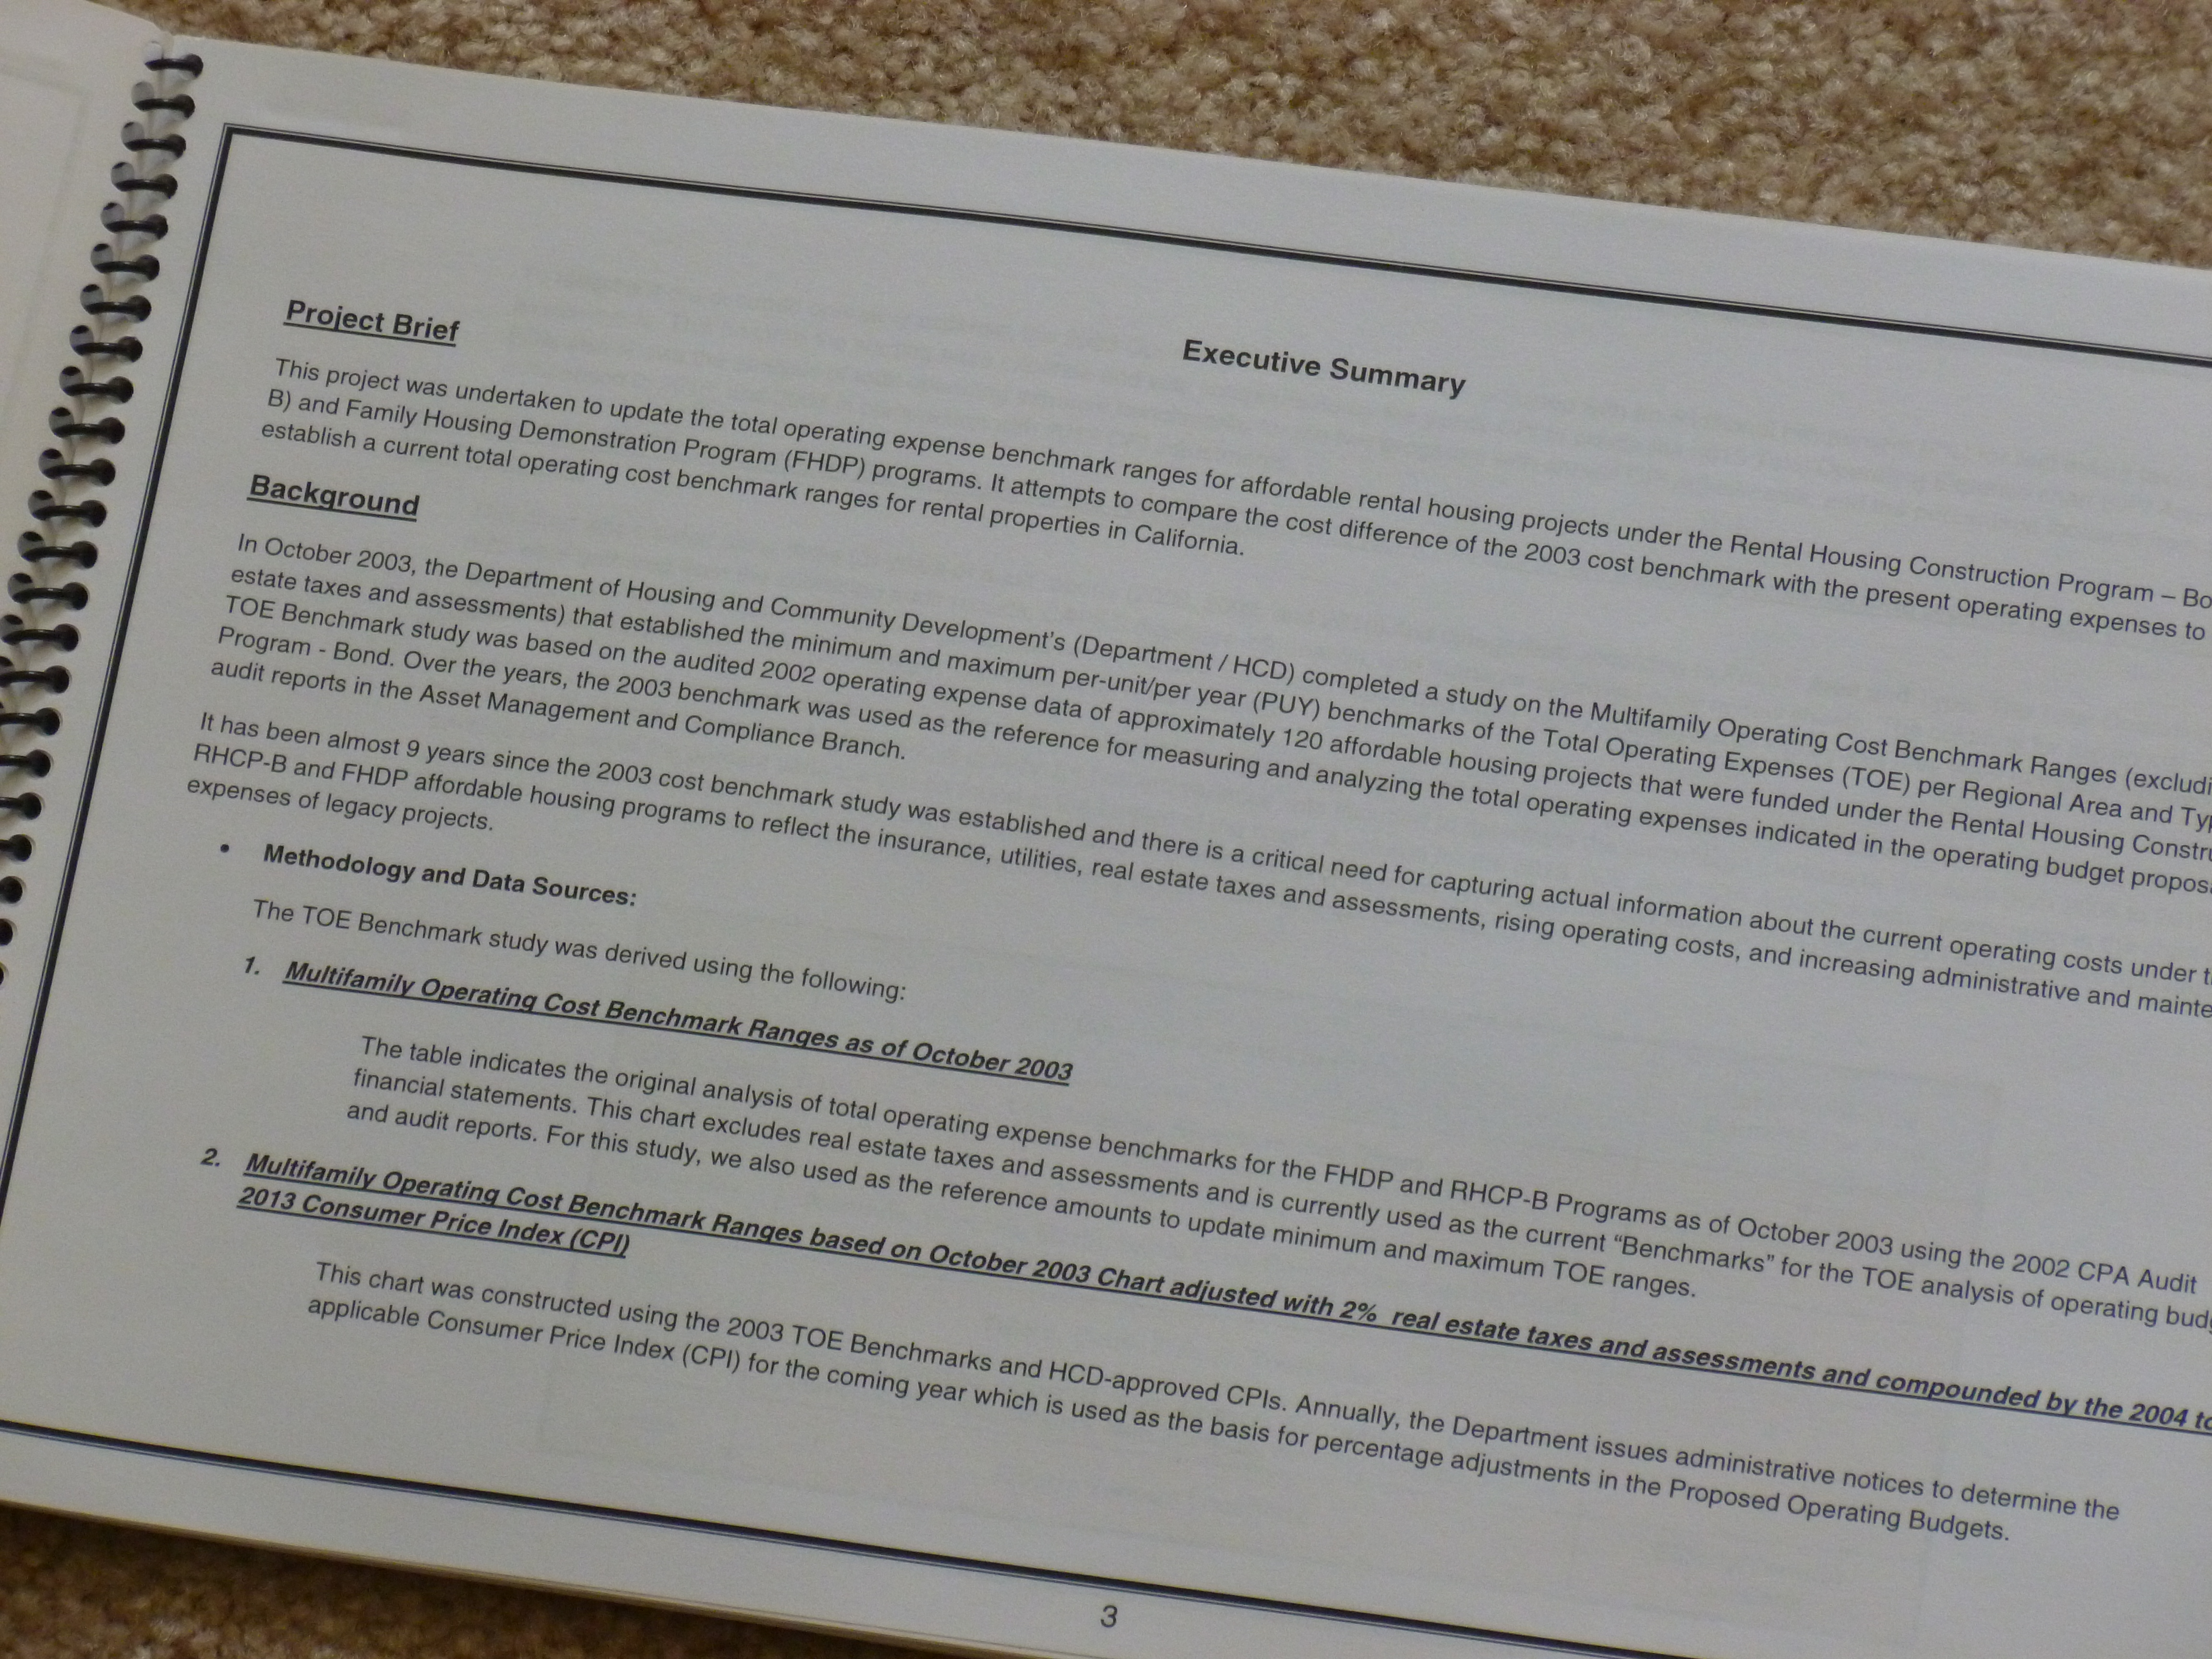
This project was undertaken to update the total operating expense ranges for affordable rental housing projects under the Rental Housing Construction Program – Bond (RHCP-B) and Family Housing Demonstration Program (FHDP) programs. It compares the cost difference of the 2003 cost benchmark with the present operating expenses to eventually establish a new operating cost benchmark. Using the audit reports for the above years and respective programs, I developed a report to capture the operating costs averages by identifying the minimum and maximum costs ranges by regions and by housing types. I also developed the analytical framework for this study, prepared and coded forms using advanced excel, and wrote the methodology, analysis, key findings, and recommendations.
Background
In October 2003, the Department of Housing and Community Development (Department / HCD) completed a study on the Multifamily Operating Cost Benchmark Ranges (excluding real estate taxes and assessments) that established the minimum and maximum per-unit/per year (PUY) benchmarks of the Total Operating Expense (TOE) per Area and Type. The TOE Benchmark study was based on the audited 2002 operating expense data of approximately 120 affordable housing projects that were funded under the Rental Housing Construction program. Over the years, the 2003 benchmark was used as the reference forvalidating and analyzing the total operating expenses indicated in the operating budget proposals and audit reports.
It has been almost 9 years since the 2003 cost benchmark study was established and there is a critical need for objective information about the current total operating costs under the RHCP-B and FHDP affordable housing programs to reflect rising operating costs and increased expenses of legacy projects such as, but not limited to, real estate taxes and assessments, current administrative and maintenance expenses, taxes, insurance, and utilities.
- Methodology and Data Sources
The TOE Benchmark study was derived using the following:
- Multifamily Operating Cost Benchmark Ranges as of October 2003
- Multifamily Operations Cost Benchmark Ranges with 2% real estate taxes and assessments and compounded by the 2004 to 2013 Consumer Price Index (CPI)
- Multifamily Operating Cost Benchmark Ranges based on the 2008 to 2010 Audit Reports of 153 Affordable Rental Housing projects under the RHCP-B and FHDP Programs.
Date


